
Overview
Topics on this page
- Functions
- Structure of the Report Designer
- Functions of the right sidebar
- Diagram options
- Tables options
Now let's get to the basic structure of the Report Designer:
Functions
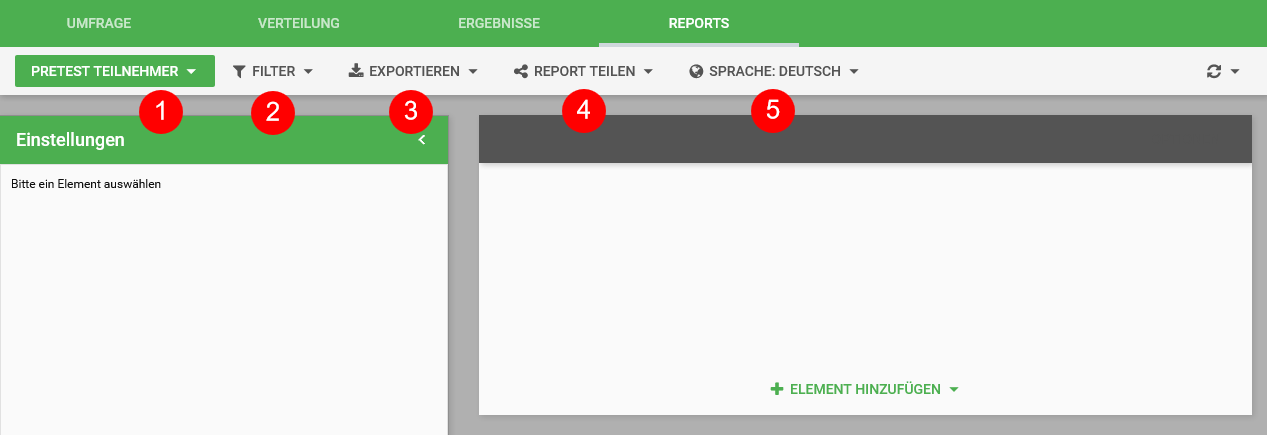
If you create a new report and do not add any elements initially, the report shown above will appear:
#-1 Do you want to evaluate the responses of the pretest participants or only those of the actual participants (without pretest)?
#-2 If you want to filter the results according to certain criteria, you can create a new filter here and activate or edit existing filters.
#-3 By means of "Export" you can download all diagrams and tables collectively. Depending on the booked tariff type, different options are available for this.
#-4 "Share Report" - Starting with the Enterprisetariffs you can share your report directly as an online report with other people, without them needing access to 2ask.
#-5 For multilingual questionnaires, you can switch between the stored languages here.
Structure of the Report Designer
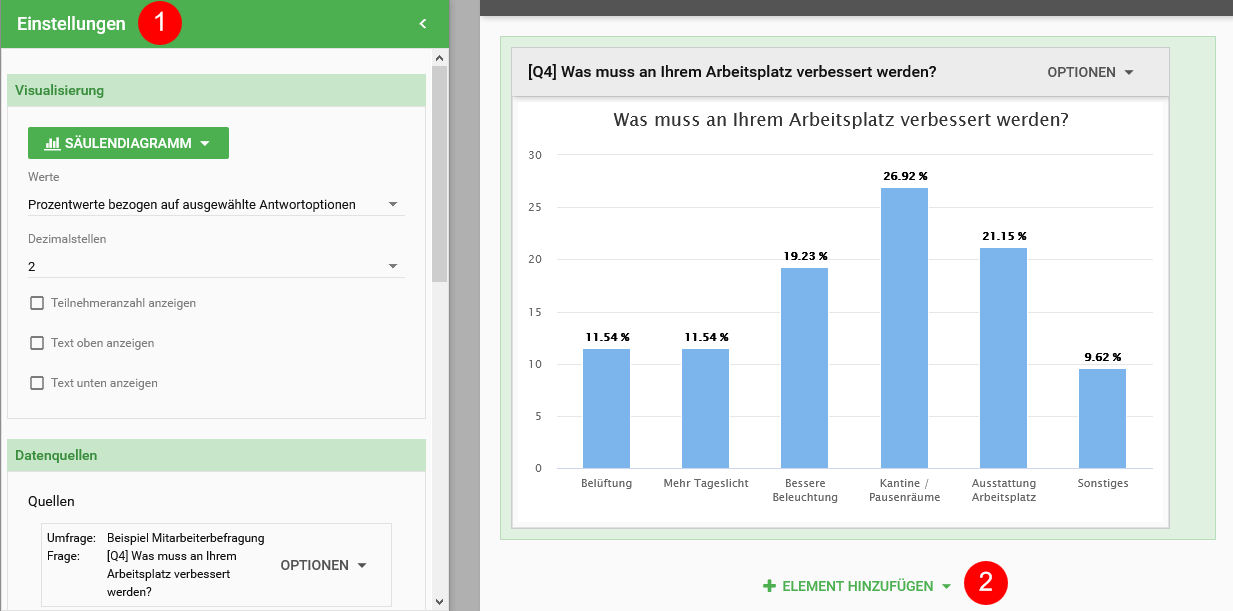
#-1 On the left side you will find the "Settings" area for the selected chart.
#-2 Via "+ Add Element" you can add either one or more new question(s), a description or a page break to the report. In addition, you will also find the "Breakdown" feature here.
Functions of the right sidebar

When you hover over the element with the mouse pointer, a sidebar appears on the right. Via this you can:
- add another element by clicking on the "+" buttons before or after the element
- by using the up/down arrow to move the selected element
- use the "trash" button to delete the element
Diagram options
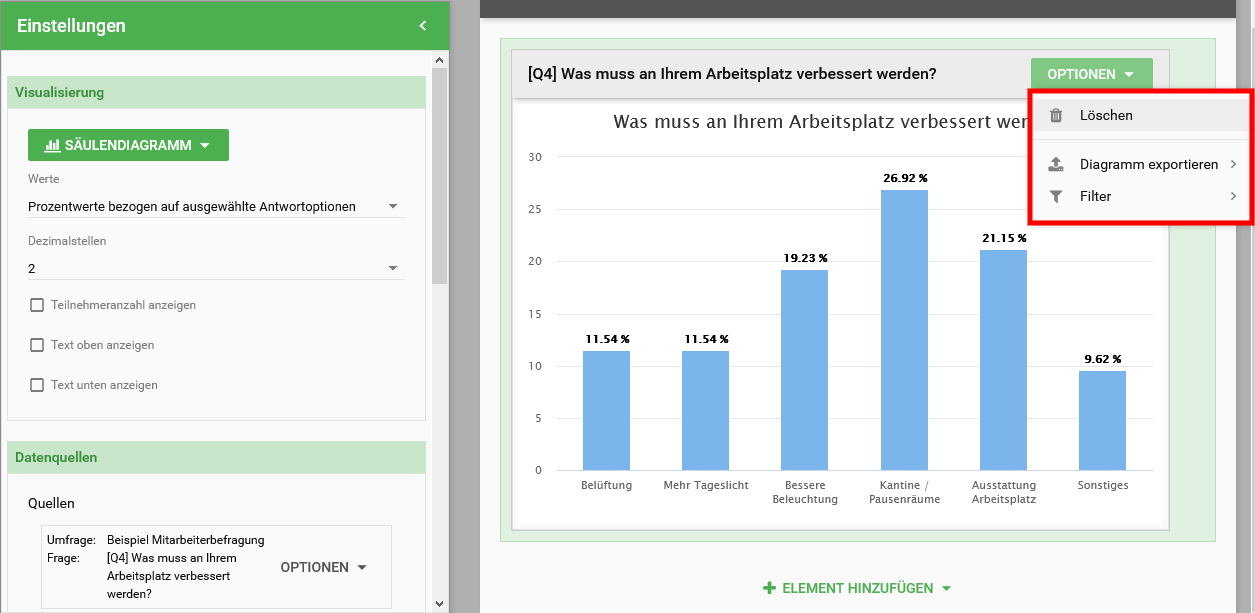
As visible in the red highlighted area, you can use the "Options" button to delete the selected diagram, export it individually (as .jpg, .png, .pdf or .svg) or filter it or exclude it from the general report filtering.
Tables options
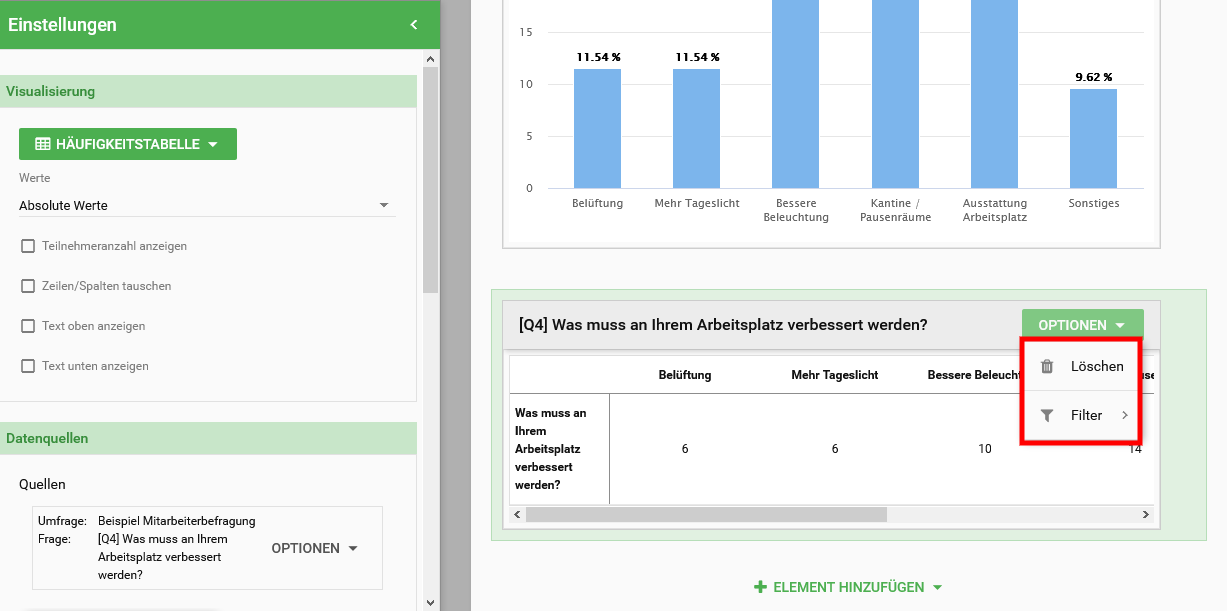
As can be seen in the red highlighted area, you can use the "Options" button to delete or filter the selected table or exclude it from the general report filtering.
Do you find this article helpful?


